Beta: Paramark Live
Last updated: September 29, 2026
In July 2026, we're launching Paramark Live in beta. You can find it under Measure in the dashboard, where it estimates incrementality since your last refresh. This article describes everything you need to know about it.
What is Paramark Live and why we built it?
Paramark Live shows a directional view of what your marketing did last week — not just last month.
Your Marketing Mix Model gives you a rigorous, periodic read on how each channel contributes to your target metric. But between refreshes, you've effectively been flying on last month's numbers. Paramark Live closes that gap.
Here's how it works
Paramark Live takes the channel effects from your most recent MMM and applies them to your data as it lands each day. Every morning, you can now see:
Spend and impressions, across every channel, in one place, updated daily as your weekly data comes in.
An estimate of incremental contribution — how much of your target metric each channel drove last week, based on your latest model.
Trend, in real time — so you always know how each channel is moving right now, without waiting for the next refresh.
It's all of your marketing data and its estimated impact, living together in one place, every day.
Why we built it
Two reasons. First, the most common question we hear between models is some version of "what's happening right now?" — and "wait for the next refresh" was never a satisfying answer. Second, the rhythm of marketing is weekly, but rigorous measurement has traditionally been periodic. Paramark Live brings the two into the same place, so the model you trust is part of your everyday workflow — not a report you open once a month.
Reading the charts in your dashboard
Paramark Live shows up directly inside your existing Measure reports. Every chart carries the same divider: a dashed vertical line marking your last MMM refresh, labeled “Last MMM” to the left and “Live →” to the right.
Incremental contribution by channel
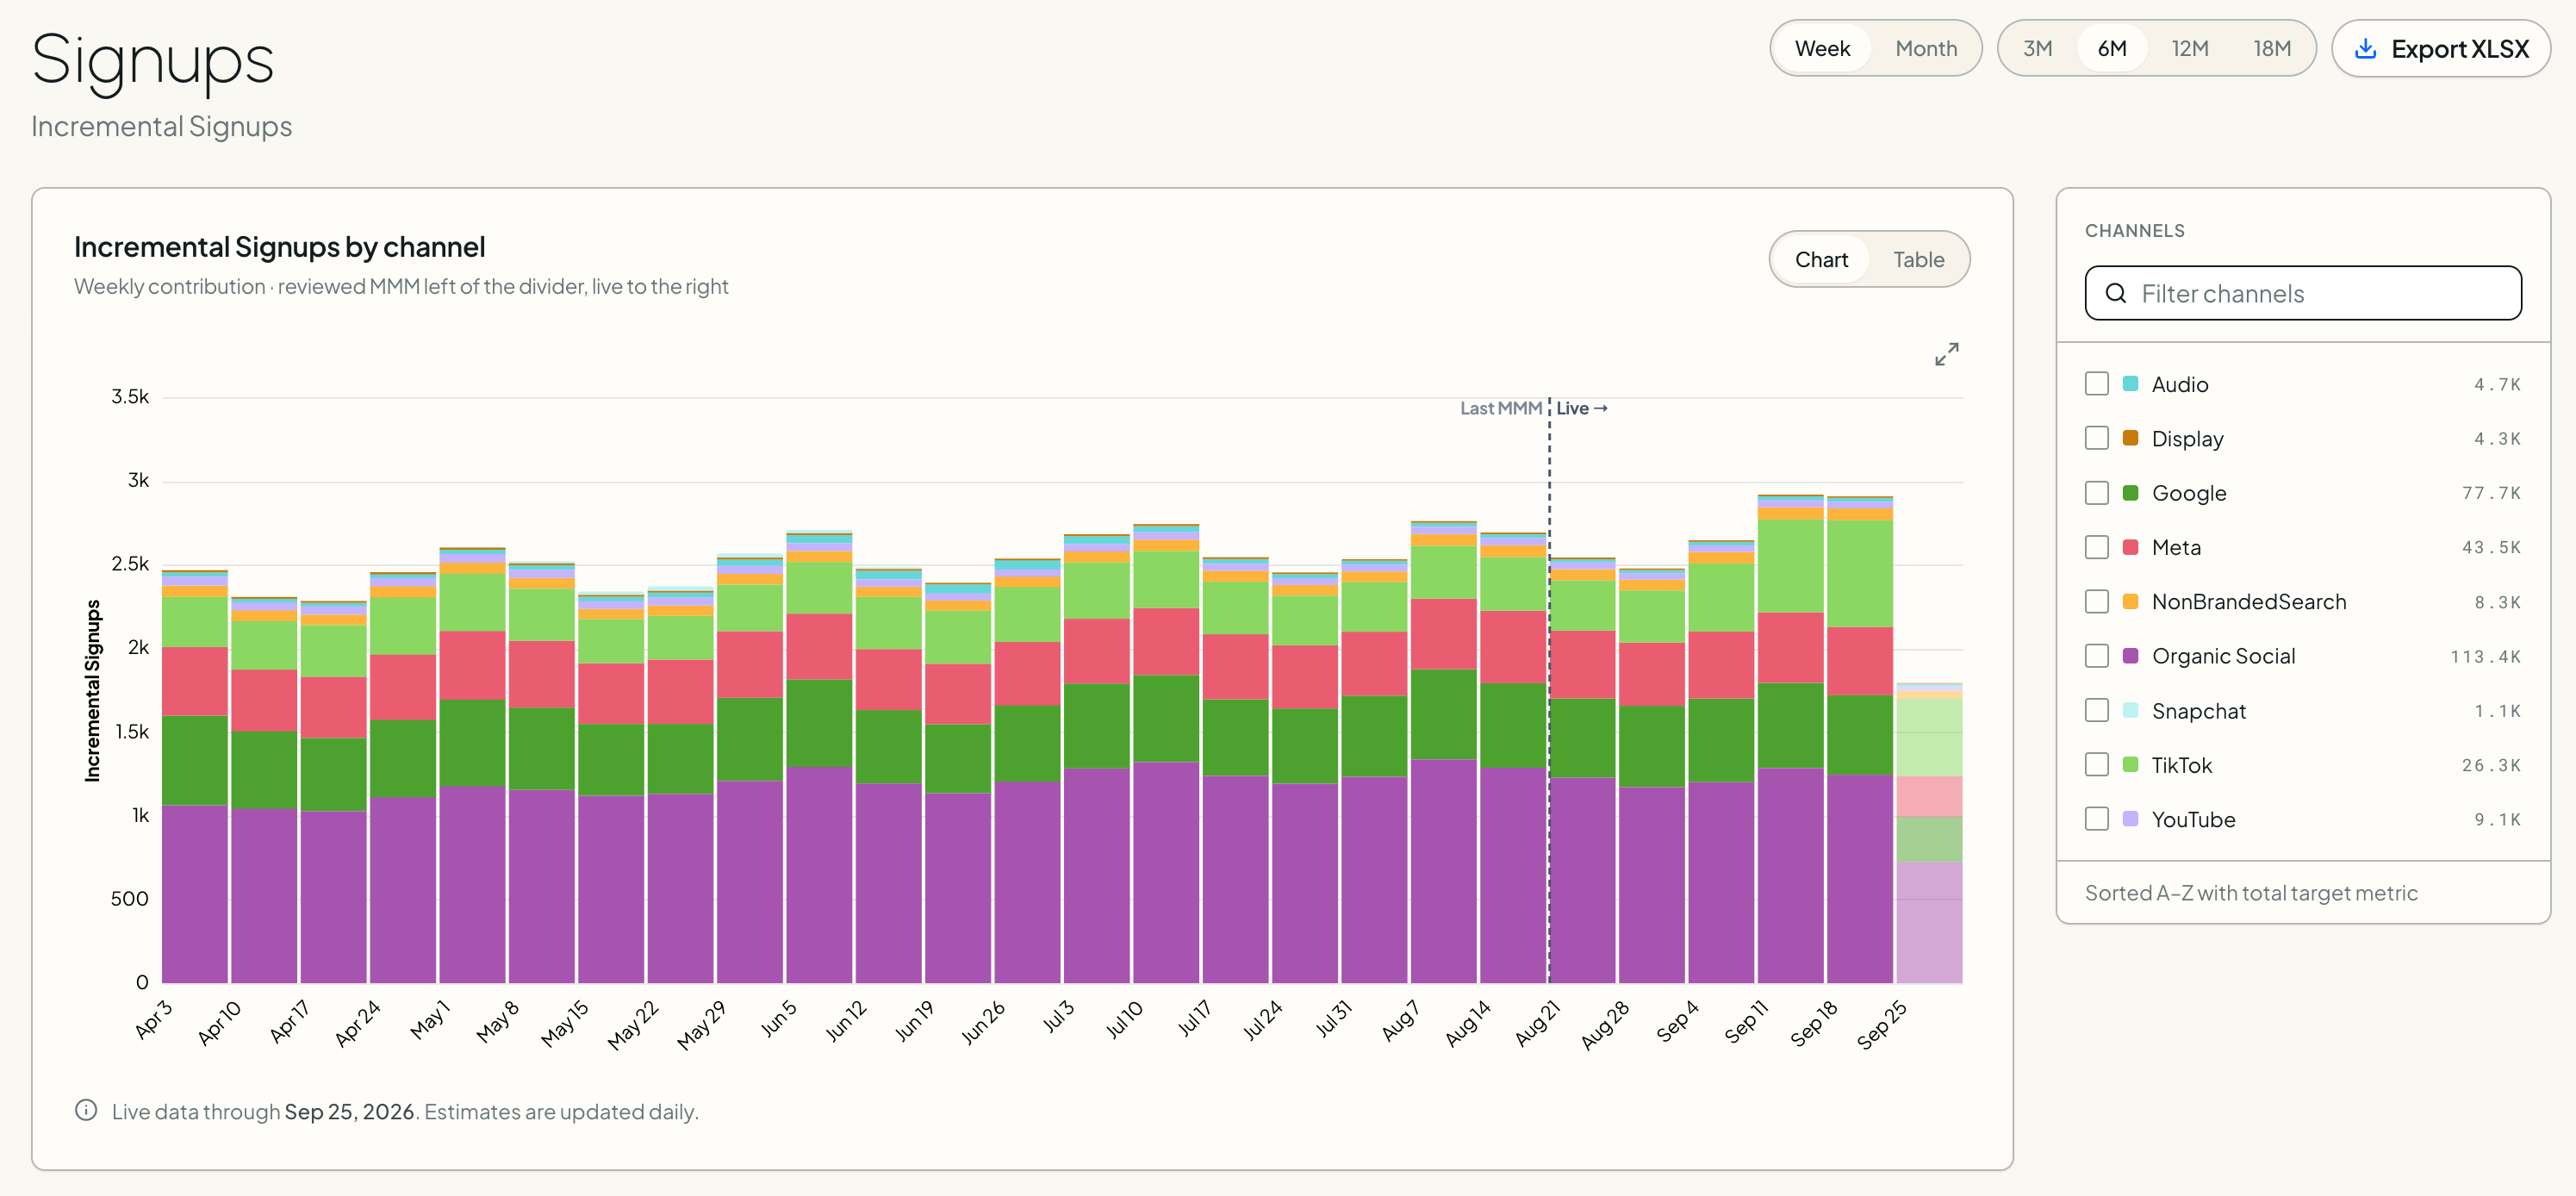
Incremental Signups by channel (live view from a Paramark sample customer dashboard)
The bars to the left of the divider are the reviewed, modeled estimates from your last MMM. The bars to the right are today's live estimates: the same channel effects, applied to the newest daily data. Colors match your channels, so you can spot which ones are picking up or slowing down day to day.
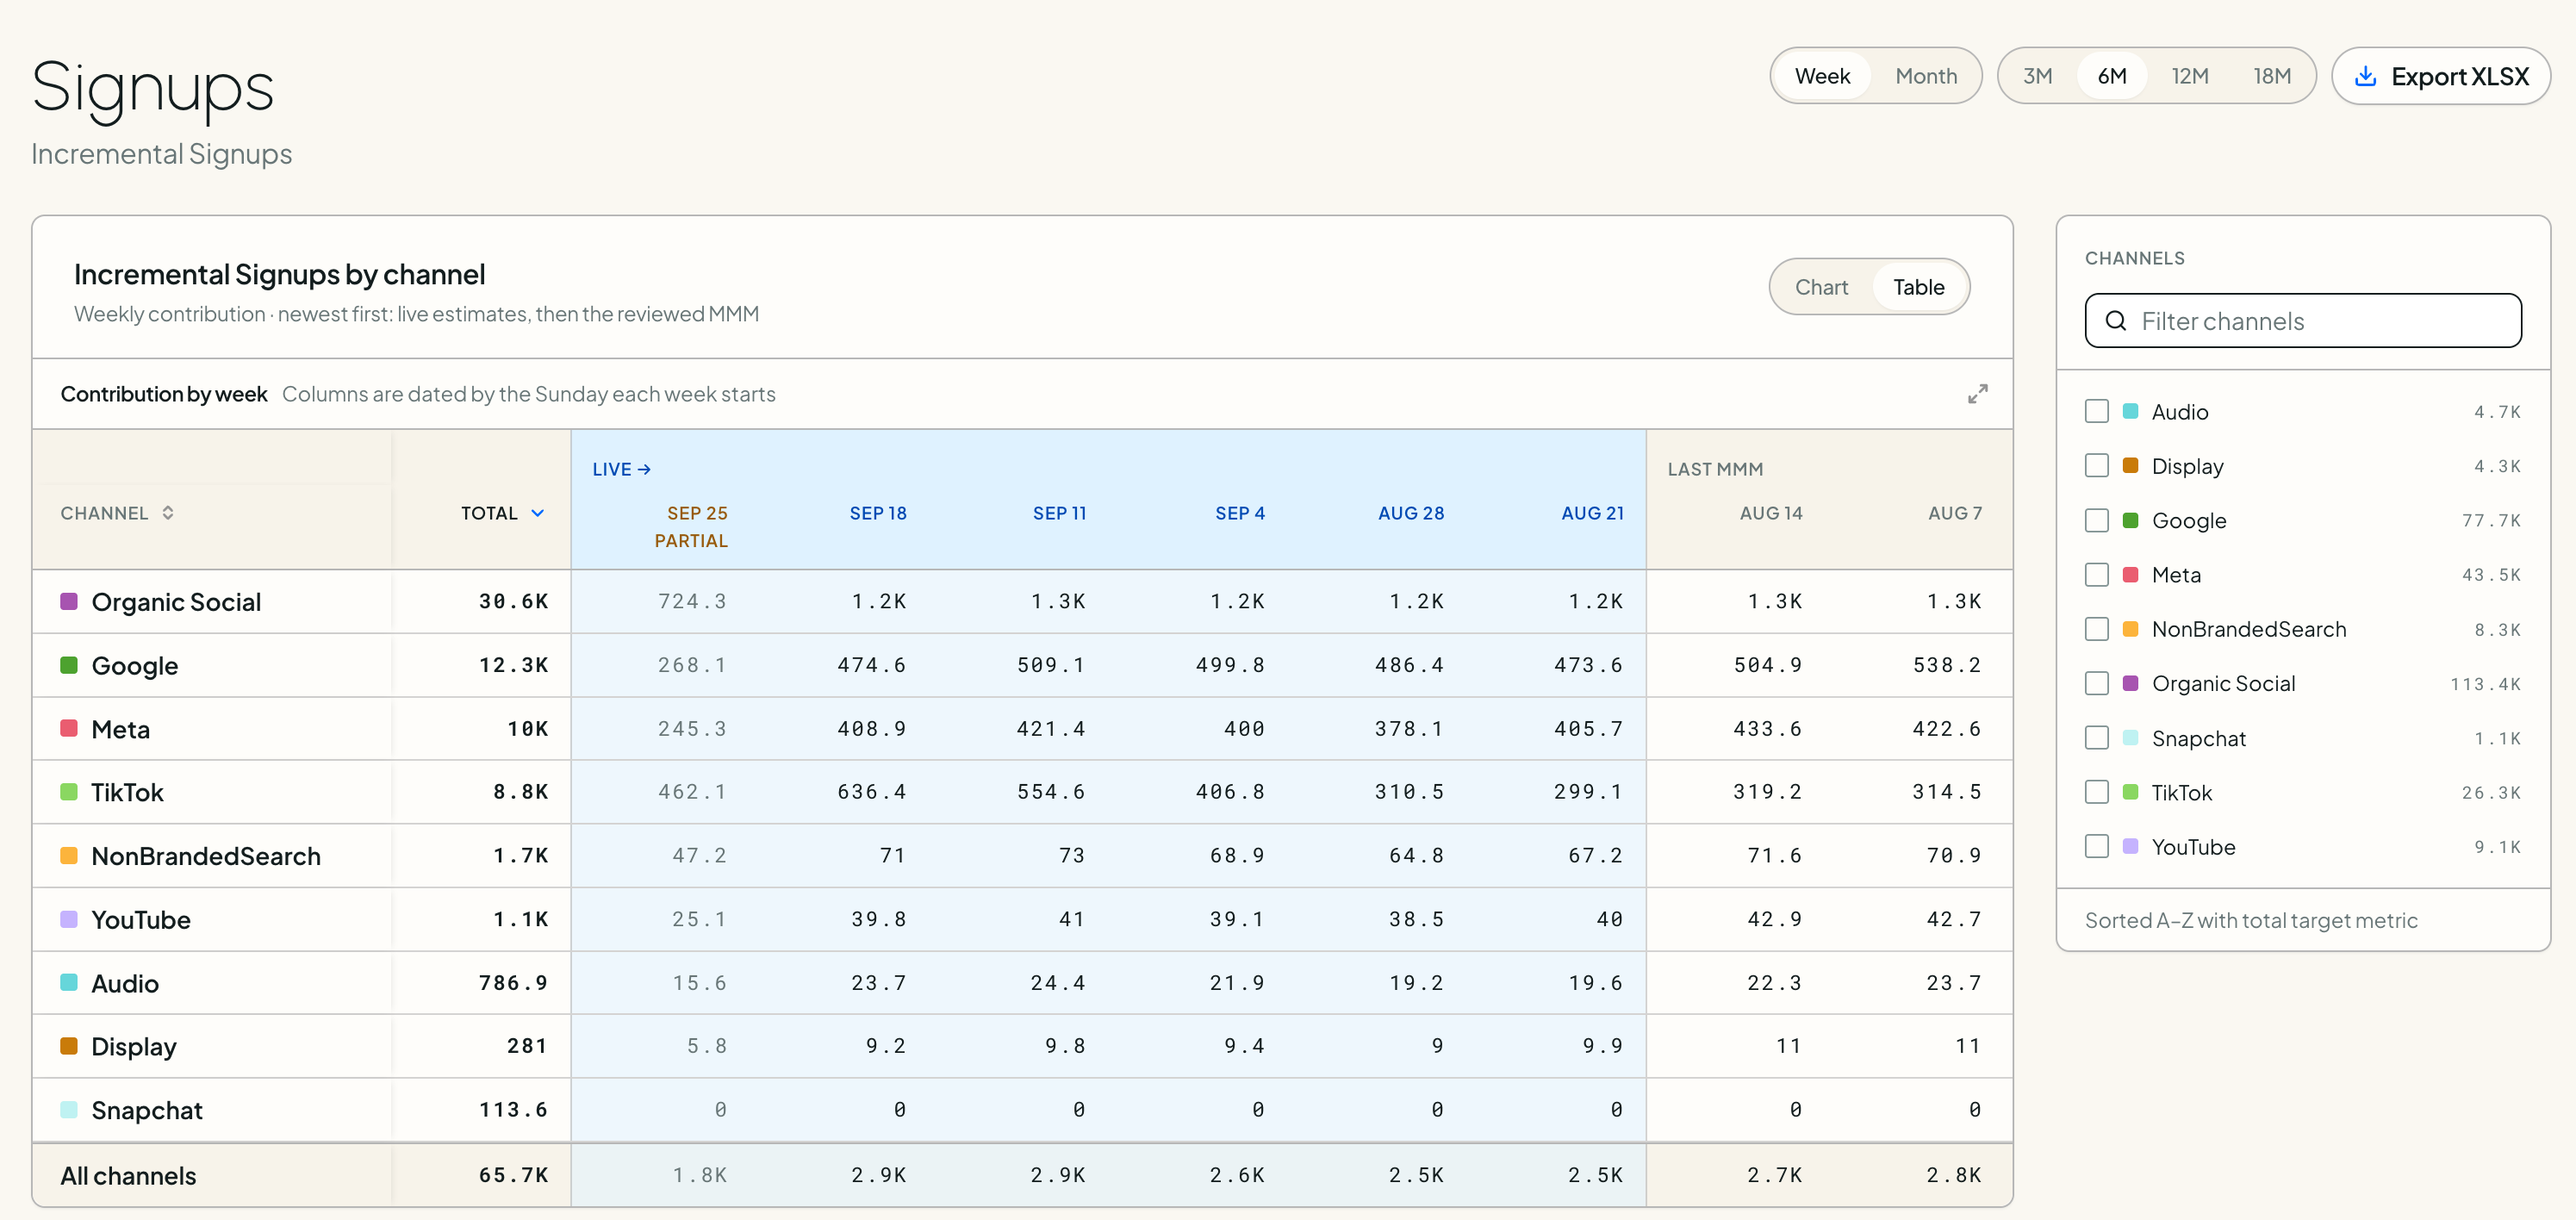
Chart / Table toggle. Use the toggle in the top-right of this panel to switch between the chart and a table view. Table view breaks out the exact weekly number for every channel — including the current partial week — so you don't have to hover over bars to read precise values.
Baseline versus incremental
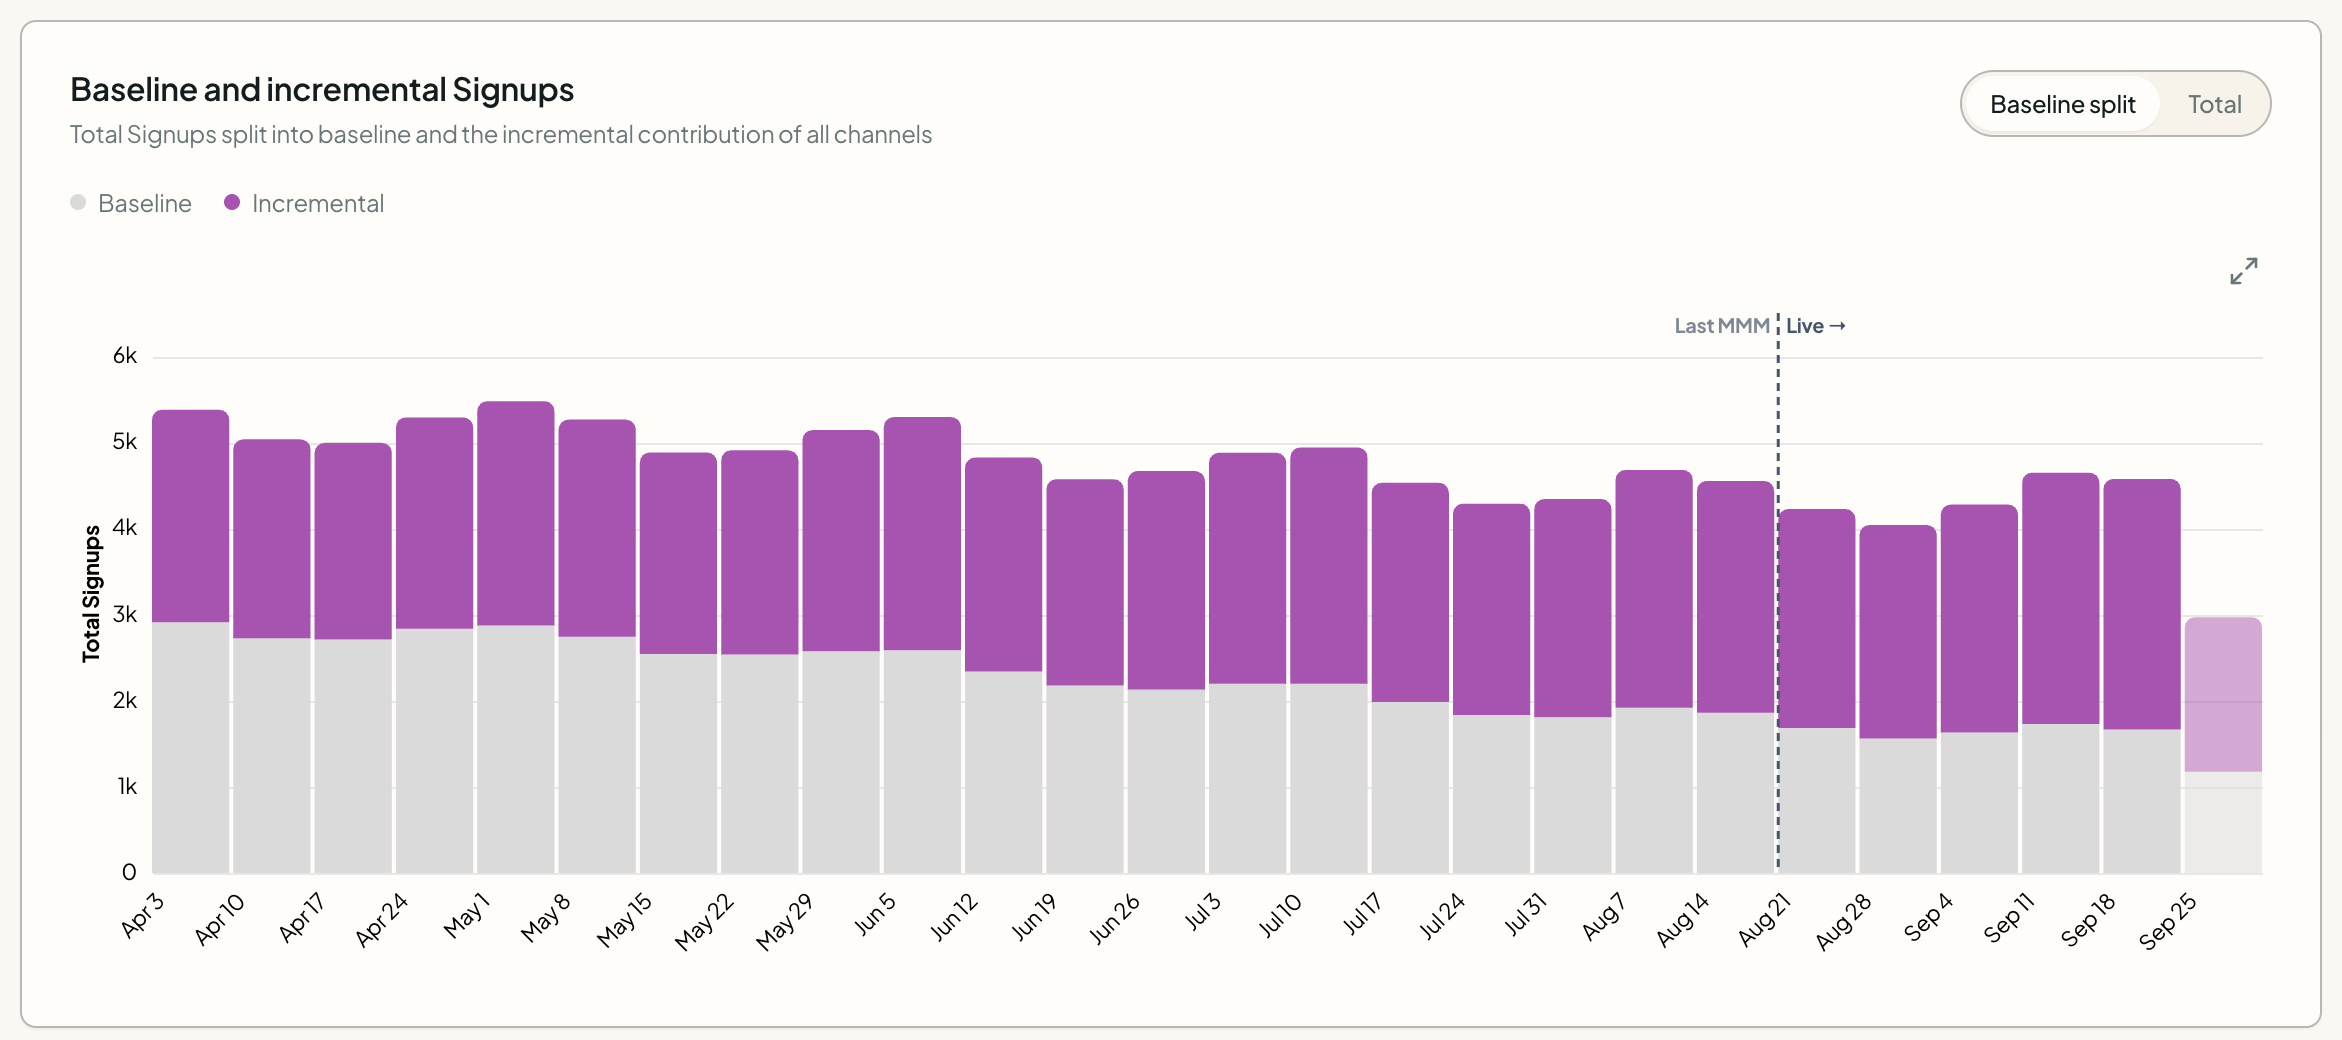
Baseline & incremental Signups (live view from a Paramark sample customer dashboard)
Zooming out to the total metric, gray shows your baseline (the level you'd expect with no marketing at all) and blue shows the incremental lift marketing is estimated to be driving on top of it. Live extends both series past your last MMM refresh, so you can watch that split shift week to week and sanity-check whether a recent spend change is showing up the way you'd expect.
Total / Baseline split toggle. This chart now has a toggle in the top-right as well. Baseline split (the default, and what we walk through below) shows baseline and incremental as separate colors so you can watch the split move week to week. Total collapses them into a single bar — handy when you just want to track the overall metric's trajectory without digging into the breakdown.
How should you use Paramark Live alongside Paramark MMM & Incrementality Testing?
Paramark Live is a new lens on your existing measurement — not a replacement for any part of it. Each piece does a different job, and they're strongest together.
Marketing Mix Modeling is the engine
Your MMM is the source of truth for how your channels actually contribute, refreshed on your regular cadence. Paramark Live doesn't build a new model. It projects your most recent MMM forward onto fresh weekly data and rescales it to your actual results. That means Live is at its sharpest right after a refresh, and naturally drifts as the market moves.
Incrementality Testing is the ground truth
Weekly numbers in Paramark Live are directional estimates — they inherit the assumptions of your last model. They're built to help you spot trends and act faster, not to settle debates. When you see something surprising and want to prove it, that's what an experiment is for. An incrementality test gives you a clean, causal read that then recalibrates the model powering Live. This is the measurement flywheel in action: experiments sharpen the MMM, and a sharper MMM makes your weekly read more operational.
One rule of thumb
Treat Paramark Live as your weekly compass, not your map. Use it to notice, ask questions, and move quickly. For decisions you can't easily walk back — big reallocations, channel cuts, new bets — confirm with your next model refresh or a controlled experiment first.
How accurate is Paramark Live, especially mid-month?
The right way to think about Paramark Live is that it is directionally useful, not a fresh re-estimation of your MMM every day. It projects the most recent model onto newly arriving data, so it is usually most trustworthy for spotting trends, pace, and relative channel movement between refreshes.
That means two things can be true at once:
It can be very helpful operationally for answering “what seems to be happening right now?”
It should not be treated like a finalized historical readout for an in-flight month or partial month.
If you are looking at an incomplete month, expect more noise than you would in a completed monthly refresh. Late-arriving conversions, reporting lags, data backfills, and normal month-to-date volatility can all make an in-progress view look different from the eventual settled picture.
A good rule of thumb is:
Use Paramark Live for directional monitoring and weekly decision support.
Use your next MMM refresh for finalized interpretation, budget resets, and high-confidence historical comparison.
If a weekly Live result looks surprising, the best next question is usually not “is the dashboard wrong?” but rather “is this a true signal, an incomplete-period effect, or something the next refresh should resolve?”
How should I use Paramark Live when we shift budget from one channel to another mid-month?
If you make a live budget reallocation — for example, moving spend from non-brand paid search into Meta lead generation campaigns — Paramark Live is the best place to monitor what is happening operationally before the next MMM refresh lands.
A practical way to use it is:
Watch spend pacing first. Confirm the channel you reduced is actually stepping down and the channel you increased is actually stepping up on the expected timeline.
Use the incremental contribution view as a directional read, not a final verdict. Live helps you see whether the new mix appears to be moving in the direction you expected while the month is still in flight.
Do not treat an in-progress month as the final answer on whether the reallocation worked. Mid-month views can still move as more data lands, conversions mature, and the next MMM refresh re-estimates the full picture.
The clean rule of thumb is: use Paramark Live to monitor the shift as it plays out, then use the next MMM refresh to judge the reallocation with higher confidence.
If you are planning around a specific reallocation, many teams find it helpful to anchor on two checkpoints:
the current month in Paramark Live for pacing and directional movement, and
the next full MMM refresh for the first more complete read on how the budget shift changed channel contribution.
That combination gives you a faster operating signal without over-reading a partial month.
What if I can log in but don't see any reports yet?
If you can sign in to Paramark but your Reports page is empty, it usually means your user has access to the workspace but hasn't been granted access to any report yet — or a report that was previously shared with you is no longer shared to your user.
First, confirm you're signing in with the same email address your Paramark team invited.
If you were just added, wait a few minutes and refresh the page — access changes can take a moment to appear.
If the page is still empty, contact your Paramark team or shared Slack channel and ask them to re-share the relevant report to your user.
When you reach out, include a screenshot of the empty Reports page and the email address you used to sign in. That helps us confirm whether this is a sharing issue or a different access problem.
How do I get access to the reports dashboard?
If you need access to the reports dashboard for the first time — whether for yourself or for additional teammates — ask your Paramark team or post in your shared Slack channel with the following details for each person who needs access:
Your full name and work email address so we can grant access to the correct user.
Which report or dashboard you need access to, especially if your workspace includes multiple reports.
Whether you already have a Paramark login or need a new invitation.
If you were recently added and still cannot see the report, refresh the page after a few minutes. If access still does not appear, include a screenshot and the email address you used to sign in so we can verify whether the issue is report sharing or account setup.
Where can I access the latest MMM report, like the August report?
The latest MMM report should appear on your Reports page in Paramark once it has been shared to your user.
If you already have access, sign in with the same work email address your Paramark team invited and open the Reports page to find the newest shared report.
If you got a note that a new monthly report is ready but do not see it, the most common reason is that the report has not been shared to your specific user yet.
If the page is empty or the report is missing, contact your Paramark team or shared Slack channel and ask them to share the specific report to your user. Include the report name, your full name, and the email address you used to sign in so the right access can be granted quickly.
If access was just updated, refresh the page after a few minutes. If you still cannot see the report, include a screenshot of the Reports page when you reach out.
I got a note that a new MMM report is available, but my Reports page is still empty. What does that mean?
Usually, that means the report exists in your workspace, but it has not been shared to your specific user yet — or it was previously shared and is no longer attached to your login.
The fastest checks are:
Make sure you are signed in with the same work email address that received Paramark access. If you have multiple work emails or aliases, this is the most common cause.
Refresh the Reports page after a few minutes if the report was just shared. Access updates can take a moment to appear.
If the page is still empty, contact your Paramark team or shared Slack channel and ask them to re-share the report to your user.
When you reach out, it helps to include:
a screenshot of the empty Reports page,
the email address you used to sign in, and
the name of the report you expected to see.
That helps us quickly confirm whether this is a report-sharing issue versus a broader login or setup problem.
What should I use while the next MMM refresh is still being validated?
If your next MMM refresh is in progress and the final readout is not ready yet, Paramark Live is usually the best place to monitor what is happening between refreshes.
That does not mean Live has replaced the refresh. The refresh is still where Paramark fully rebuilds, validates, and interprets the model. But while that work is underway, Live can help you stay close to the business by showing week-by-week pacing and directional channel movement using your latest available MMM as the baseline.
Use Paramark Live to monitor near-term movement — for example, whether a channel appears to be accelerating, softening, or responding to a recent budget change.
Use the completed MMM refresh for the higher-confidence answer on what changed, why it changed, and what decisions you should lock in next.
A simple rule of thumb is: Live is for staying operationally current; the refreshed MMM is for finalized interpretation.
What if the refresh is also updating the model basis or seasonality assumptions?
That is another moment where Paramark Live is useful operationally, but the refreshed MMM should remain the final read. If the team is updating model assumptions — for example, because new months changed the seasonality pattern or because the business mix shifted — Live can still help you track week-by-week pacing while validation is underway.
Use Live to stay close to current movement while the refreshed model is being finalized.
Use the completed refresh to understand the updated explanation for why performance changed and whether those shifts should alter budget decisions.
A helpful way to think about it is: Live tells you what appears to be happening now; the refreshed MMM tells you how to interpret that movement once the new model basis is fully validated.
How should Paramark Live inform experiment recommendations after a refresh?
A practical workflow is to use your refreshed MMM to identify the two or three channel questions that matter most, then use Paramark Live to monitor how those channels are pacing while you decide what to test next.
Use the refreshed MMM to set the hypothesis. For example: should we pulse down PMAX, lean harder into Meta, or validate another budget shift before making it larger?
Use Paramark Live to watch the near-term movement. Live can help you see whether spend pacing and directional contribution are moving the way you expected between refreshes.
Use an experiment for the highest-stakes decision. If the budget move is meaningful or hard to reverse, treat Live as directional context and confirm the biggest choice with a structured test.
A simple rule of thumb is: MMM frames the decision, Paramark Live helps you monitor it, and experimentation gives you the cleanest causal answer when confidence matters most.
Why doesn’t the total chart change when I apply a channel filter?
Some summary views in Paramark Live are designed to show the full business outcome, not just the filtered channel slice. In those views, the total includes baseline + all channel contribution, so the chart may explicitly note that it is not affected by the channel filter.
That means a channel filter can change a channel-level breakdown while the top-line total stays the same. This is expected when the chart is answering two different questions at once:
The total view answers: “What happened to the full outcome metric overall?”
The filtered breakdown answers: “How is the selected slice distributed within that outcome?”
If you are comparing two charts and one appears fixed while another changes with filtering, first check the subtitle or note beneath the chart title. If it says the metric is not affected by the channel filter, you should expect those two views not to move in lockstep.
Why can two buyer or order charts look directionally similar but not match exactly?
Two charts can move in the same direction and still show different numbers if they are built from slightly different definitions or filters. Before treating that as a discrepancy, check whether the charts are aligned on the same:
business lines or breakdown categories (for example DTC only versus DTC + HCP + Partnership),
region or other report filters,
metric definition (buyers, orders, shipments, or another related measure), and
view logic, including whether the chart is showing a full total or a filtered slice.
A practical rule of thumb is: if you want two charts to reconcile closely, make sure they are using the same population, date range, and filters before comparing the totals. If those settings are not aligned, the charts may still be directionally consistent without being numerically identical.
How can you provide feedback?
Paramark Live is in beta, which means your feedback genuinely shapes where it goes next. We're actively iterating — on the visuals, the time horizons we show, and the insights we surface — and we want to hear from you.
The fastest ways to reach us:
Message your Growth Advisor directly, or drop a note in your shared Slack channel.
Tell us what's working, what's confusing, and what's missing — especially the moments where the weekly read helped you make a faster call, or left you wanting more.
A few prompts that are especially useful to us right now: Is the weekly contribution estimate clear and helpful? Are the right channels and time horizons showing up? What would make this a part of your weekly and daily routine?
Thanks for helping us build it. This is just the first version — and the best ideas for where it goes next will come from the people using it every day.