Beta: The Data Tab
Last updated: September 29, 2026
In September 2026, we're launching the Data tab in the Paramark dashboard. The Data tab gives you a single, up-to-date view of the marketing data Paramark has collected for your model(s) — spend and impressions across every channel, over time. The tab refreshes automatically every day, so what you're looking at always reflects the latest data Paramark has on file, with no manual pull required.
Access: once the Data tab is enabled for your workspace, you'll find it in the main navigation on the left of your Paramark dashboard. If you have more than one MMM dataset, you'll see a separate Data tab entry for each one, so you can go straight to the dataset you need.
What is the Data tab and why we built it?
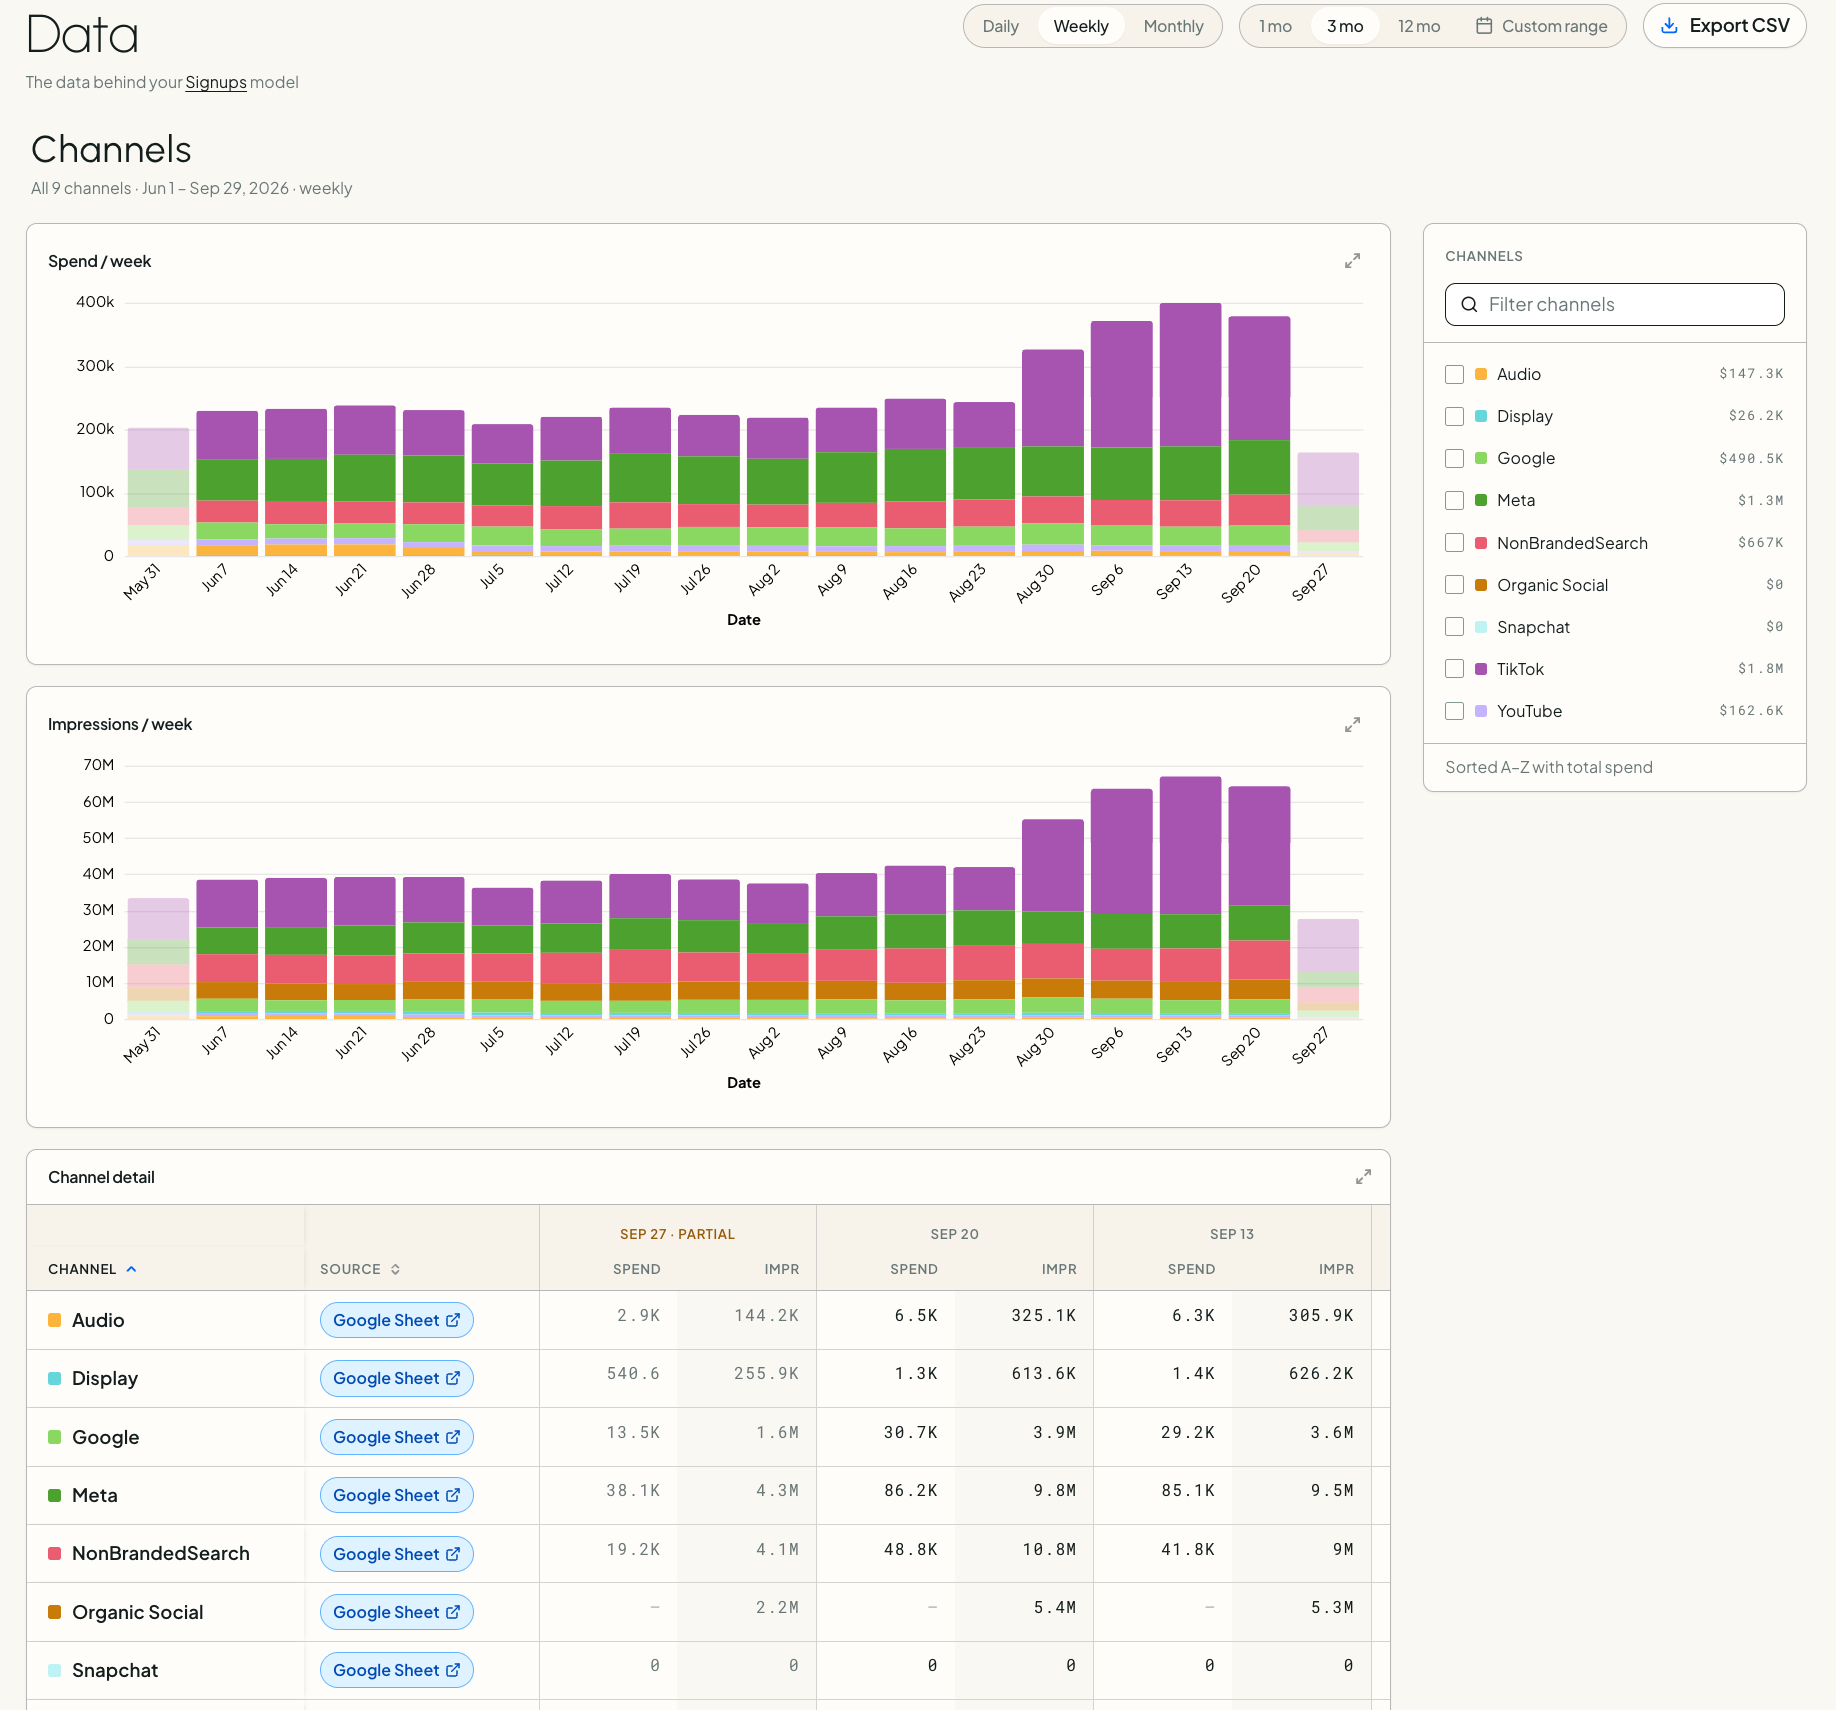
The Data tab is a visual and tabular view of the data behind your Paramark measurement. It brings the marketing inputs Paramark has on file (including spend and impressions) into one place so your team can review, sanity-check, and export the underlying numbers. Alongside the row-level table, you'll find visualizations and summary statistics for the dataset you're viewing, so you can spot trends and pacing at a glance before deciding whether you need to dig into the detail.
Your MMM and Paramark Live both depend on clean, current marketing data. But when you want to answer a simpler operational question, ie: what data does Paramark have right now?, you shouldn't have to wait for a readout or ask your Growth Advisor to confirm every source manually. The Data tab makes that source data visible directly in the dashboard.
Why we built it
We built the Data tab because teams often need a quick, trustworthy way to see what is currently flowing into Paramark before a meeting, an executive question, or the next MMM refresh. It helps you confirm whether data is up to date, spot obvious gaps, and pull the same underlying numbers into your own reporting when needed.
Where to find it
Open the Data tab from the main navigation in your Paramark dashboard. If your workspace has more than one MMM dataset, each one has its own entry in the nav, so selecting a dataset takes you straight to its table, visualizations, and summary stats. The table itself opens with the most recent dates shown first, so the latest values are visible without scrolling across the full history.
What you’ll see
The Data tab opens on a visual summary — charts and summary statistics for the dataset you've selected — so you're not required to dig into row-level numbers unless you want to. It keeps the default view simple and streamlined, while still giving you full access to the underlying table whenever you want it.
When you do drop into the table, your marketing data is laid out as follows:
Channels run down the rows — Google, Meta, and every other channel in your marketing mix.
Dates run across the columns, with the most recent dates shown first.
Each cell shows spend and impressions recorded for that channel in that period.
You can adjust the granularity of the view to look at your data by day, week, or month, depending on how closely you want to zoom in.
How to use the table
The on-screen table is optimized for quick scanning. Use it to:
Confirm whether the latest data has landed for each channel.
Check spend and impression pacing before a customer meeting, leadership discussion, or budget review.
Spot missing or unexpected values that may be worth raising with your Growth Advisor.
Understand the raw marketing activity feeding into your measurement before interpreting downstream model outputs.
Where your data comes from
Every dataset in the table is labeled with its source, so you can see where a given number originated. Depending on how your data is connected to Paramark, you may see sources such as:
Ad platforms — pulled directly from platforms like Google and Meta.
BigQuery — hover to see the specific table name the data came from.
Amazon S3 — for data delivered by file, hover to see the file name.
Other connected warehouses and connectors, such as Snowflake or Fivetran.
If a source label looks off for your setup, let your Growth Advisor know. Labeling data to its true source is something we care about getting right.
Which models use this data
Each dataset includes a short note showing which of your Marketing Mix Models rely on it, with a link to the associated model in Paramark Live — "Live" is highlighted in that note so it's easy to spot at a glance. Not every dataset is necessarily used by a model: some data may be on file without yet feeding an MMM, and the note will make that clear rather than implying every dataset is in active use.
The link points to the parent model, from which you can reach every report generated from that data. That keeps the link useful even as new models are built on the same dataset over time.
Exporting your data
Use Export CSV to download the data behind the view.
The export comes in long format — one row per channel, date, and metric — rather than the wide layout you see on screen. Long format works cleanly in pivot tables and other reporting workflows, making it easier to reshape the data for your own team’s analysis.
Good to know
The Data tab reflects the marketing data Paramark has on file for your measurement, so it is a reliable way to confirm what is current and what may still be pending ahead of your next MMM refresh.
The table is meant to help you inspect inputs, not replace the interpretation you get from your MMM, Paramark Live, or Growth Advisor conversations.
The on-screen table is wide for quick scanning; the CSV export is long for analysis. Same data, two shapes.
If a source, channel, or value does not look right for your setup, share that feedback with your Growth Advisor so the team can investigate.
Why an export may use internal channel mappings
Some CSV exports may reflect Paramark's internal channel mappings rather than the raw platform labels exactly as they appeared upstream. This is intentional: those mappings are the logic Paramark uses to bucket incoming data into the reporting structure that powers your measurement.
In practice, that means an exported row may be labeled according to the channel grouping Paramark uses internally for your workspace, so the export stays aligned with the way your data is interpreted in downstream analysis.
If the labels in the export do not match the exact cut you expected, the first thing to check is whether the underlying grouping or mapping rules were designed to roll those rows into a broader or renamed bucket. If you need a different breakout, ask your Growth Advisor to confirm which mapping logic is currently being applied and whether it should be adjusted for future refreshes or exports.
How can you provide feedback?
The Data tab is designed to make Paramark’s underlying marketing data easier to inspect and use. If you have questions or feedback, message your Growth Advisor directly or post in your shared Slack channel.
We especially want to hear whether the table is helping you answer the questions you had in mind: Is the latest data easy to find? Are the source labels clear? Does the CSV export work for your reporting workflow? Thanks for helping us make the data behind your measurement easier to use.